
Do This One Thing, and You Could Increase Your Marketing ROI by 50%…
There’s no doubt that increasing return on investment (ROI) is a key priority for today’s marketers. In fact, 61% of marketers ranked improving “their ability to measure and analyze their marketing efforts” as a vital priority, according to the Demand Generation Benchmark Survey Report. But only 25% of marketers today are confident they can measure ROI, according to a report by Nielsen.
Here at Claritas, we’ve seen firsthand how measuring and optimizing campaigns can pay off for our clients. Here’s just one example: We worked with one group of auto dealers that used the Claritas Identity Graph to build privacy-compliant profiles of prospects who were in-market – or highly likely to buy. They then targeted them with a multitouch marketing campaign that lasted six months.
The result? The average dealer ROI per dollar spent was a whopping $33.82. But here’s the real kicker: those dealers that measured results and used that data to optimize their campaign spend had a 50% better average return than those who did not.
That’s right, 50% better!
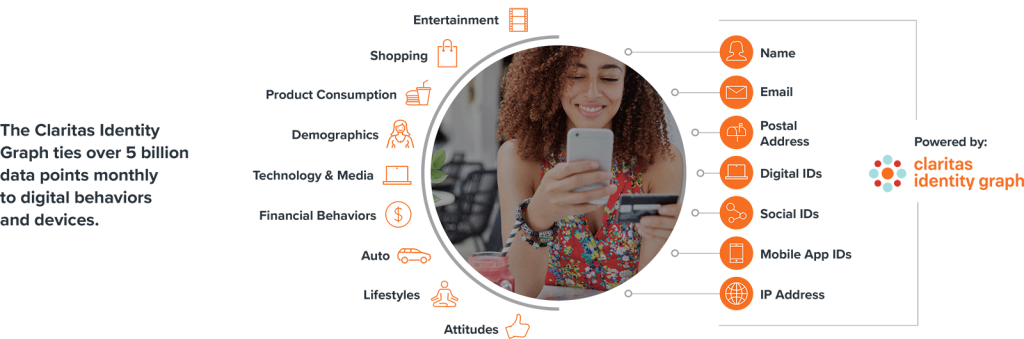
So how exactly do you measure your marketing ROI? By using the measurement tools powered by an intelligent identity graph.
The Science of Connecting Exposures to Conversions
An intelligent identity graph allows you to connect customer exposures to conversions to enable true multi-touch attribution. Using an intelligent identity graph, you can connect the dots in a customer’s purchasing journey so you can analyze and understand how multiple online and offline engagements with the same customer actually contribute to a sale.
An intelligent identity graph allows you to connect the dots by feeding all data into one customer record. This allows you to use analytics to break down the buying process to understand which engagements contributed to the customer’s decision to buy – and adjust your campaign accordingly.
So, for instance, you can determine if your direct mail campaign led to conversions on your website. Or if your television ads caused someone in the household to buy. Or if your online display ad drove customers to your store.
The right graph will collect exposure data (both online and off) and connect that to conversion data (both online and off) to determine which channels and audiences are performing the best.
It can even collect data from multiple tags placed on creative messaging to determine which messages are performing better – filtered by channel, audience segment and partner. Then you can use that data to obtain a holistic view of a customer’s entire purchasing path in near real-time – a critical step in achieving multi-touch attribution.
Case in point: When one financial industry client launched a campaign to market a co-branded credit card, it turned to Claritas to measure both online and offline conversions that tied to consumer media exposure. It then used that data to optimize its campaign as it ran. As a result, it decreased its acquisition costs by 94%.
But you can also use an intelligent identity graph to fine-tune your analysis even more.
Isolate Conversion by Channel Using “Lift Analysis”
You can also use an intelligent identity graph to calculate conversions using a technique called “lift analysis.” This technique lets you isolate and measure the effectiveness of each channel, device, message or partner in your campaign – even when an offline campaign results in online buying or vice versa.
A lift analysis is made possible by combining identity graph data and a unique control group methodology to precisely measure specific marketing campaign segments. For instance, you can use it to measure exactly how effective one portion of your campaign – such as television spots or billboards – is in getting people to buy.
It works by using identity graph data to compare an “exposed” group, which is made up of people who have been exposed to the campaign, to a control group, which is made up of people who look like the exposed group but haven’t seen the campaign.
As the campaign runs, you measure the “lift” – or the difference between the conversion rate of the exposed group and that of the identical control group. That tells you the true conversion rate of the campaign.
This technique is highly effective in measuring offline campaigns that result in online conversions – such as billboards or other type of out-of-home (OOH) advertisements.
That’s why Wrapify, an OOH company offering on-vehicle advertising, uses Claritas’ identity graph and its Conversion Tracker lift analysis to show its clients exactly how effective their campaigns really are. Wrapify used the Claritas tools to prove to clients like Alaska Airlines that the airline’s online booking rates for one flight jumped 20% thanks to its vehicle advertising campaign.
It showed companies like Zoom that website conversion rates increased 13% thanks to Wrapify advertising. And it proved to the MLB’s San Diego Padres that the team increased game-day foot traffic by 1,005% as a direct result of wrapped vehicle advertising.
Lift analysis is also effective with channels such as podcasts, where the true conversion rate is difficult to calculate. In the case of podcasts, marketers have been limited to cumbersome tracking measures such as vanity URL visits and coupon codes – which typically capture less than 10% of the actual response to a podcast and leave marketers largely in the dark about the true effectiveness of their podcast campaigns.
Lift analysis is a game-changer for companies in the podcasting space because it allows companies to accurately and precisely calculate podcast conversions without requiring any coupon codes or vanity URLs.
That’s why Entercom, a leading media and entertainment company and one of the two largest radio broadcasters in the U.S., recently began using Claritas’ intelligent Identity Graph to help Entercom advertisers measure attribution and accurately determine the portions of their podcast and digital streaming campaigns that contributed to a purchase, store visit or app download.
How to Get More out of Every Marketing Dollar You Spend
The bottom line is that an intelligent identity graph lets you truly understand your prospects and what leads them to buy. An intelligent identity graph gives your company a proprietary understanding of people, places and behaviors to drive a better ROI, both online and offline.
It helps you answer the business questions you need answered – so you can get the most out of your marketing spend.
For more information on how an intelligent identity graph can help you boost your ROI by giving you the ability to better identify your customers, deliver the right message to those customers and optimize that message and its delivery as your campaign runs, check out the new Claritas white paper, Leveraging Identity Graph Intelligence to Find and Reach Your Best Customers.
Be sure to also check out our recent Smart Marketers Guide to Optimizing Campaign ROI report to see best practices marketers can use to more accurately analyze the effectiveness of their multichannel marketing campaigns.