
The Simple Secret Behind Successful Multichannel Attribution
In today’s multichannel world, one big aspect of accurately measuring your campaign involves multichannel attribution, which is the process of linking a consumer behavior – such as a purchase – back to a specific marketing touchpoint.
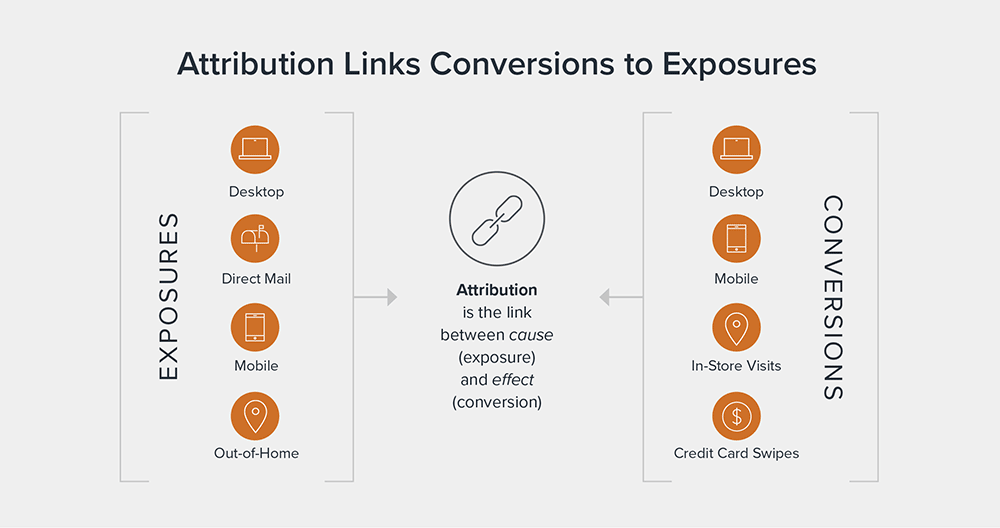
Consumers interact with brands across many environments. Therefore the secret to effective attribution is capturing as much of a consumer’s daily experience as possible and analyzing their engagements across a number of different exposure and conversion environments.
An intelligent identity graph can help you fully understand the customer’s purchasing path and how each customer engagement contributes to a final sale.
An intelligent identity graph allows you to link your first party data to consumer identifiers like postal addresses, emails, mobile IDs, or IP addresses – so you can see exactly how a specific consumer is engaging with you across channels. This allows you to see, for example, how direct mail advertisements influenced someone to purchase an item from your website.
Any combination of activities across these exposure and conversion environments can play a role in a consumer’s conversion path. Understanding this purchase journey is a critical part of measuring attribution across multiple channels.
The Magic of the 30-Day Attribution Window
The best way to link an in-market behavior and/or an actual purchase back to a marketing touchpoint is to create a 30-day attribution window. Attribution windows are look-back periods that begin with a consumer behavior, like buying a product, and extend backward a consistent number of days, such as 30 days. If a household is exposed to an advertisement during that period, we consider their purchase an “attributable conversion.”
The illustration below shows how these windows are anchored at the point of purchase.
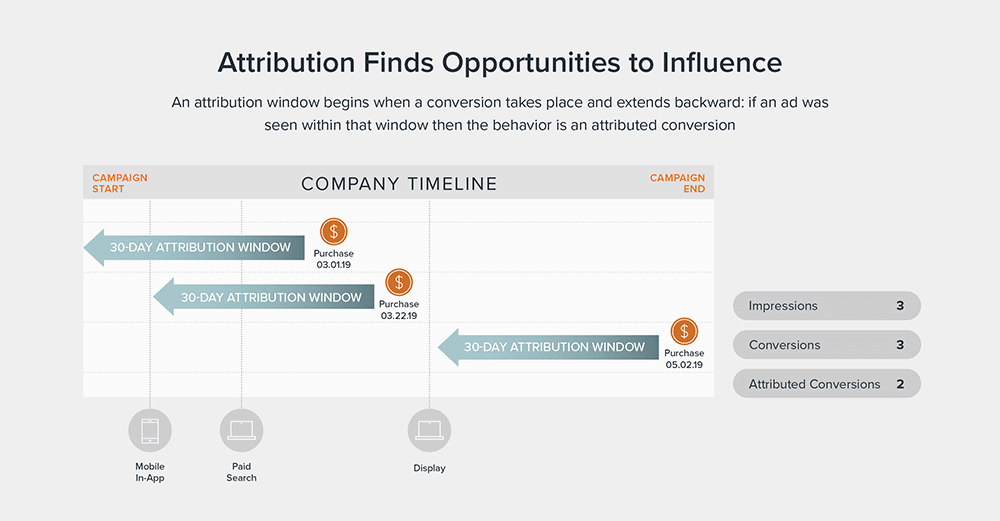
In one of the examples above, a purchase was made on March 1. Looking back 30 days, this household was exposed to two advertisements: one within a mobile app and another through a search engine. These are called “working impressions,” because they have the ability to influence behavior.
Let’s look at a different scenario: a display ad that doesn’t actually fall within an attribution window. Although it may contribute to the long-term impact of an ad, you cannot assume it has a short-term influence.
Understanding Recency vs. Relevance
Looking at attribution windows allows you to clearly see both recency and relevance.
Recency ensures that we’re not attributing a conversion to an exposure that occurred a year ago. For instance, if you are exposed to an ad today and you made a purchase 12 months from now, it’s likely that the exposure today didn’t have any influence on that purchase.
Similarly, relevance ensures that we’re not attributing a conversion to an exposure that happens two weeks into the future, which obviously could not have influenced the decision to purchase.
Let’s consider an everyday scenario: Say I’m in the market for some jeans. Last night I visited Levi’s website and ordered a pair of their 511s. Three days before that, I received a Levi’s catalog in the mail, which I happened to thumb through.
Attribution is the process of linking the purchase of those jeans with the fact that I looked through the catalog. It’s the process of identifying whether a marketing touchpoint (in this case, looking through the catalog) had the opportunity to influence my in-market behavior (purchasing the jeans). This process is the foundation of campaign measurement.
Campaign measurement helps answer the question: What’s working well and what isn’t? Consumers can experience many combinations of marketing touchpoints along their path to a conversion. And as all marketers know, some channels are effective at directly driving conversions while others work better in combination.
Display Ads Drove Majority of Conversions
For instance, take a look at the conversion data in the illustration pictured. It’s apparent from this analysis that display ads are an important part of this campaign. Not only do these ads directly influence 45.1% of attributable conversions, they also assist in three more conversion paths accounting for an additional 41% of conversions.
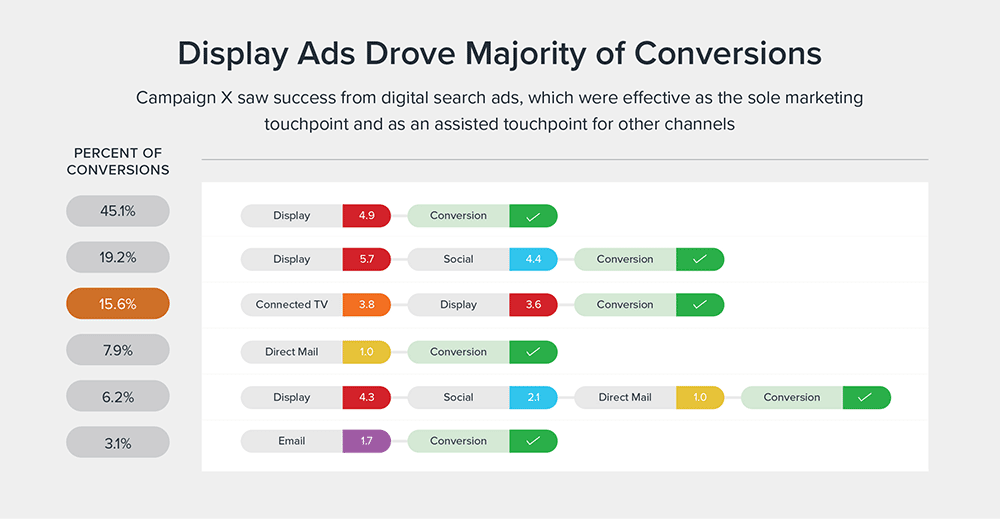
Maybe less apparent is the impact of connected TV ads. If you were to only look at last-touch attribution, you wouldn’t see much influence from this channel. Given the premium cost per thousand impressions (CPMs) for connected TV inventory, the channel may run the risk of being removed unless its contribution can be better understood.
Although it doesn’t directly drive conversions, connected TV assists in two conversion paths, influencing 15.6% of attributable conversions. Maybe connected TV ads provided a strong introduction to a particular category need, and only through reminders in the form of exposures from display or email ads did consumers actually convert. Removing connected TV risks losing this introduction and, ultimately, the conversions.
For example, the audience that contributed 15.6% of total attributed conversions may not normally respond to display ads. It was only because they first saw an advertisement on their connected TV that created brand awareness and consideration, which are critical steps in a consumer’s purchase journey.
How to Triple Your Conversion Rate… by Simply Improving Your Measurement Tools
Understanding where various marketing efforts fit into the conversion path allows companies to get more out of their marketing dollar by better understanding which channels are actually driving purchases. For example, one fitness retailer, a Claritas client, sent out a direct mail campaign and measured a 2% conversion rate using traditional methods such as QR codes and vanity URLs.
But Claritas discovered that the direct conversion rates underestimated the effectiveness of the direct mail campaign. Because when the client used the Claritas Identity Graph to link IP addresses/mobile IDs to the physical addresses of households that received the mailer, it found something quite interesting. About 6% of the households that received the physical mailer used their online devices to either research or purchase from that brand after receiving it.
So the percentage of customers who engaged after receiving the mailer was actually three times higher than the response linked directly to that mailer.
By feeding all your conversion data into one customer record, you can use analytics to break down the buying process and truly understand exactly how multiple touchpoints with the same customer actually result in a sale. That’s essential to understanding and maximizing return on investment (ROI) in an omnichannel marketing campaign.
To find out more smart strategies that will help you optimize the return on your multichannel marketing campaigns, click here to download your FREE copy of Claritas’ new white paper, The Smart Marketer’s Guide to Optimizing ROI.
Need help finding your next customer?
Questions
Please contact the Claritas Sales Team at866-ROI-TEAM (866-764-8326)
Current Clients
Please contact the Solution Center at855-400-ASST (855-400-2778) for immediate assistance