
Why Most Return on Ad Spend Calculations are Wrong
When we talk to our clients here at Claritas, this question comes up a lot: How can we more accurately measure Return on Ad Spend (ROAS) for our marketing campaigns? As I’m sure you know, ROAS is a metric of efficiency that creates a standardized view of campaign performance.
ROAS can be presented as visits per dollar spent, sales per dollar spent, or engagements per dollar spent, just to name a few. Any KPI used to gauge the performance of a campaign can be used in the ROAS calculation.
Many of our clients use ROAS as an indicator for the success of a campaign because they can compare it to past campaigns, both their own campaigns and others in the category.
But to accurately calculate ROAS, you have to understand one key metric. You have to know exactly how many buyers purchased as a direct result of your campaign.
Calculating this metric accurately has been almost impossible in this multichannel world – until now. Here at Claritas, we calculate that number using a measurement methodology called “incremental lift analysis.” Incremental lift is the change in consumer behavior resulting from exposure to advertising when all other influences are taken into account.
We all know that some people who are exposed to a marketing campaign will perform the behavior being measured, regardless of that exposure. For instance, a family of five will likely purchase more cereal than a single-person household. Someone who attended a ballgame will be more likely to do so again versus someone who has never been to a game.
So even if it produced a high level of conversions, a campaign may not have been effective if those individuals would have purchased anyway. Claritas’ incremental lift analysis uses a control group methodology to calculate the attributable conversions. That’s the number of consumers who made a purchase as a direct result of a podcast or other specific marketing investment.
The Best Way to Calculate a Campaign’s Lift Rate
How does it work? Claritas uses Identity Graph data to create two groups that exhibit the same external “factors” that might cause them to buy. One of these groups is the “exposed” group, which consists of those who have been exposed to the campaign. And the other is the “control” group, which is made up of people who look exactly like the exposed group but haven’t seen the campaign.
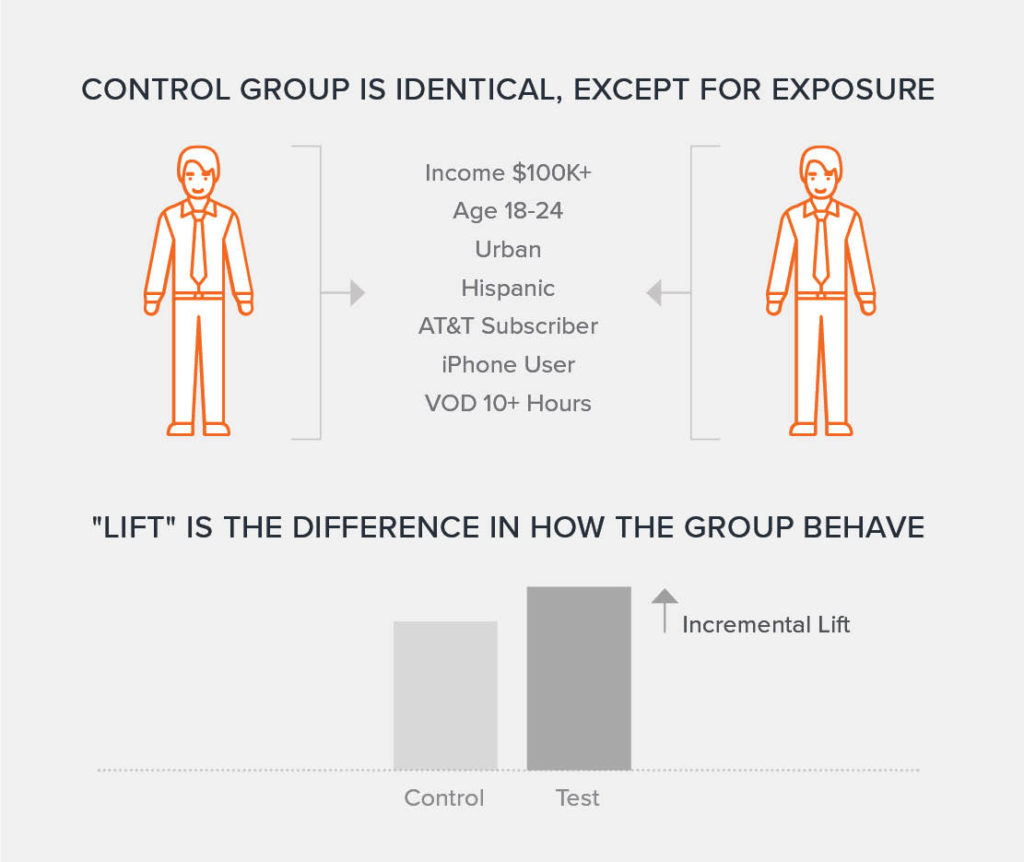
As the campaign runs, you calculate a “lift rate,” which compares the conversion rate of the exposed group to the conversion rate of the control group. This lift rate, also referred to as the incremental lift rate, represents the true conversion rate of the campaign. That’s because it controls for those factors outside of the campaign that might influence buying behaviors, such as a previous relationship with the advertiser.
Why is the Claritas Control Group Methodology the Best Way to Calculate a Campaign’s True ROAS?
Claritas’ unique lift methodology tells you exactly how many conversions you generated from a particular campaign such as a podcast campaign.
Calculating the number of incremental conversions gives you access to never-before-available metrics that allow you to truly understand the cost of your campaign and your true ROAS because it ONLY measures the buyers who purchased as a direct result of a campaign.
Not only does this help you calculate the true return you made on the campaign, it also lets you determine how to adjust the campaign to improve the return on your investment (ROI) in the future.
How to Determine Which Conversions Were the Direct Result of the Campaign
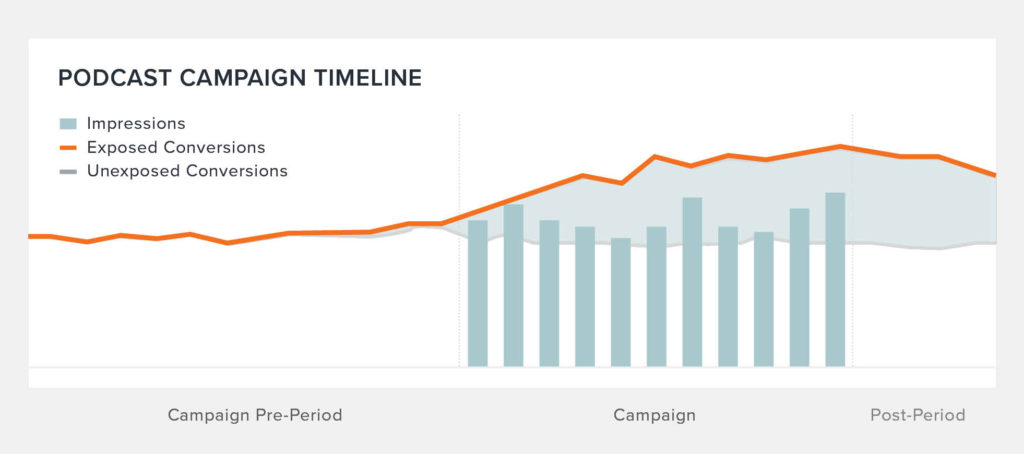
Let’s look at an example. Say 50,000 households were exposed to a particular podcast campaign. Using Identity Graph data, you determine that 2,870 households accounted for 4,005 specific conversions and $1 million in sales. But the reality is that some of those buyers would have purchased even without exposure to the campaign.
Claritas conducts an incremental lift analysis to determine the actual sales number generated by a campaign. Claritas first creates a control group made up of individuals who were NOT exposed to the campaign – but have the same characteristics as those who were.
Claritas then compares the control group’s conversions to the conversions made by the group of 50,000 podcast listeners – to determine how many people who were exposed to the campaign would have purchased anyway.
Now you’ll remember that the 50,000 podcast listeners who did hear the ad generated 4,005 conversions. But if the 50,000-person control group produced 3,135 conversions, that means that 3,135 out of those 4,005 purchases made by listeners would have been made anyway – even if the buyers hadn’t heard the ad.
So that means that the number of purchases that could be attributed directly to the campaign – also known as the incremental conversions – totals 870.
Calculating Return on Ad Spend
Knowing the exact number of attributable conversions – and the resulting sales – allows you to accurately calculate the return on ad spend (ROAS).
For instance, in the campaign mentioned above:
- if the campaign cost $975
- reached 50,000 people
- directly generated 870 conversions
- and those 870 conversions resulted in over $230,000 in incremental sales…
…the cost per thousand (CPM) would be $19.50. But the return on your ad spend would be a whopping $235.90 per $1.00 spent.
Using Incremental Lift Analysis to Improve Your Campaign’s Performance
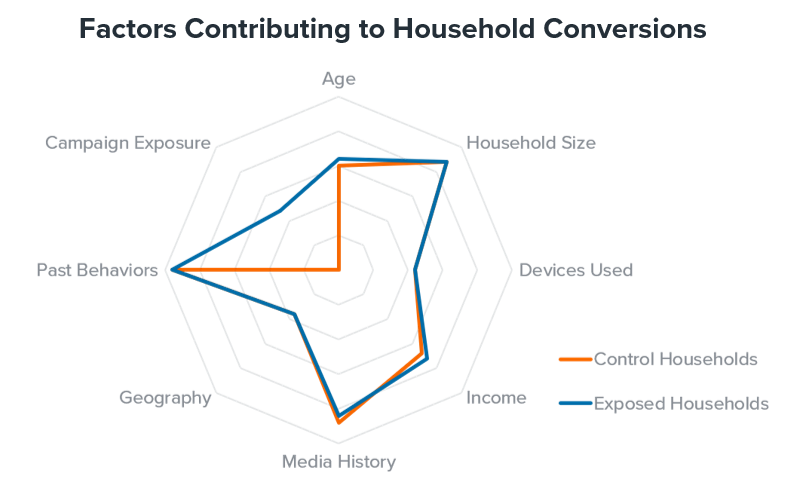
In addition to helping you determine the overall effectiveness of your campaign, calculating incremental lift can also help you answer the question, “What factors contributed to a customer’s conversion, and what factors didn’t?” That’s because you can use an incremental lift analysis to isolate particular portions of your campaign to get insight on how well a portion performed compared to other aspects of the campaign.
For instance, you can use it to truly understand what drove incremental conversions (and the campaign’s ultimate performance) by analyzing which audiences responded better to an advertisement. You can use it to determine if a particular creative, property, message or media channel was more effective at generating a response. And you can even use it to determine which of your marketing partners delivered a better return on your marketing investment. Claritas makes insight like this available via an easy-to-read dashboard.
Then you can use that data to improve campaign results. For instance, using incremental lift analysis and consumer segmentation data, you can determine which type of consumers responded better to a particular message or channel. Then you can use Claritas segmentation data once again to help you gain additional insight into this audience – to personalize the messaging and engage these consumers using the media channels that they prefer.
Podcasting Advertisers Now Have a New Way of Measuring ROAS
There are many different ways you can use incremental lift to optimize your campaigns and grow your business. It is especially helpful in areas of marketing where calculating ROAS has traditionally been difficult, such as podcasting.
Marketers have traditionally found it difficult to determine the effectiveness of the podcast channel – in large part due to limited podcast attribution methodologies. Until recently, vanity URLs, promo codes, and surveys after a purchase were the only tools available to measure podcast advertising effectiveness. Today, Claritas is helping podcasting companies provide their advertising and marketing clients with deeper insights into the effectiveness of their podcast advertising channels.
For example, Entercom has partnered with Claritas to allow its podcast advertising clients to accurately isolate and measure the effectiveness of each channel, message or partner in their campaigns. Entercom uses Claritas analytics tools to conduct lift analyses for clients that compare the buying behaviors of those households that listened to the podcast to that of similar non-listening audiences.
This collaboration between Entercom and Claritas is enabling podcast advertisers to measure attribution and accurately determine the portions of their campaigns that contributed to a purchase, store visit or app download.
In fact, marketers are now able to measure each specific portion of their campaigns with never-before-available precision, allowing them to optimize campaigns as they run to maximize their return on investment. As a result of the partnership, Entercom advertisers are able to break out lift by the different components of a campaign, like target audiences, creative, geographic location and more.
A Revolutionary Way to Measure Multichannel Campaigns
The measurement tools provide a completely new way to tie multichannel exposures to offline and online conversions – and they are revolutionizing the way podcast campaign conversions are measured.
Claritas is working with many of our clients to help them more accurately calculate Return on Ad Spend, incremental lift, cost per conversion and other key metrics. We also help our clients better leverage these metrics using segmentation and other techniques to create more effective marketing campaigns.
Contact us for more information on how Claritas can help you create more effective marketing campaigns and grow your business. Or download your FREE copy of Claritas’ new white paper, Podcast Campaign Lift: A Guide to Accurately Analyzing Campaign Conversion Rates.
Need help finding your next customer?
Questions
Please contact the Claritas Sales Team at866-ROI-TEAM (866-764-8326)
Current Clients
Please contact the Solution Center at855-400-ASST (855-400-2778) for immediate assistance